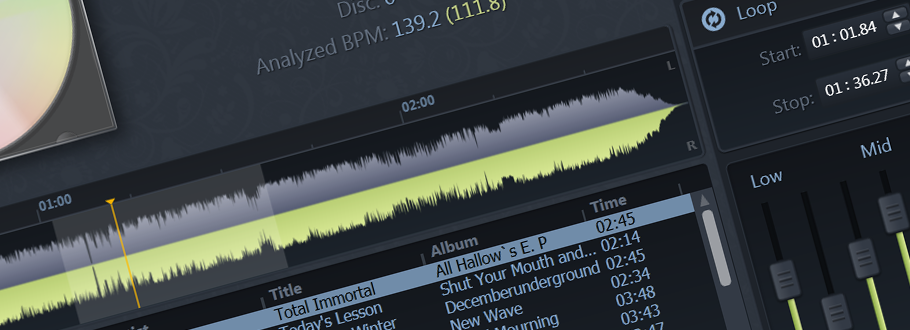
By popular demand, I’ve added an example of how to use the WPFSVL with NAudio as the sound engine powering it. I’m still plugging away at the “getting started” documentation for both BASS and NAudio, but if you get the latest source for WPFSVL, you’ll now have an example application to work from. The way I do sample updates and stereo FFT updates is actually a bit different from anything included in the normal NAudio examples, so I encourage you NAudioers to check it out. The normal examples do FFT at every complete sampling. I have it set up to only do FFT on request from the spectrum analyzer, so my performance seems a bit snappier than other NAudio sample applications out there.
I haven’t had as much time to work out the kinks in the NAudio example, so let me know if you’re seeing anything odd. I know I’m still struggling with certain MP3 files returning strange level data on the waveform. Also, since NAudio is managed code, the performance isn’t quite as snappy as the BASS examples (but still quite decent).


Awesome! These visualisations look wonderful. Far better than the ugly stuff I have been building for the NAudio WPF demo! I’d love to include these in some way in the NAudio demo apps if at all possible. Get back to me and let me know what you think. I’ll also have a look at how you’ve improved performance. The current NAudio WPF demo was knocked up very quickly for a presentation I was giving and has terrible performance. I’ve improved it a bit since, but doing FFTs on demand seems a better approach to save CPU cycles.
Hey Mark, thanks for the compliments. I’d be honored if some of my stuff made it in to the *official* demos!
Cool, I’ve added a link to WPFSVL on the NAudio homepage, and will hopefully incorporate it into the NAudio WPF demo really soon.
I’ve also realised that for proper spectrum plots I really need to apply windowing (e.g. Hamming) on the audio data before performing an FFT. I don’t think that will quite work with the way you have integrated with NAudio, as you might perform an FFT on a buffer whose write position could be anywhere in the middle of the buffer (unless I am mistaken). I might try creating a double-buffer approach (one being filled, one full waiting for a spectrum analyzer request) meaning I can apply the windowing function and ensure that no discontinuity in the middle introduces rogue frequencies.
Yeah, that’s a good point. I shouldn’t have missed that 🙂
I think double buffering in the sample aggregator would be a quick/ideal solution for that. Create a second channelData array and swap between them. The one that you’re not currently filling should be safe to use a windowing algorithm on.
I’m actually surprised how unnoticeable it is in the visualization. Let me know what you come up with and I’ll drop it into my samples as well. I’ve been getting some requests for features indicative of people wanting scientific-level accuracy rather than simple eye-candy (like specific frequency mappings on particular bands).
Where you really notice lack of windowing is when you are watching the trace from a sine wave sweep. You get energy of around -70dB in every bin if you forget windowing. However, for the type of metering you are doing with a limited number of bands, it may not matter too much. For my WPF demo app I tried to plot every point in the FFT results (all 512 of them), but the resulting line was very jagged (except for the sine wave sweep test). I don’t know what professional spectrum analysers do to smooth out their curves – possibly average over a few bins to reduce the number of points and use some kind of bezier curves to make the line smooth?
Well, here’s an old WinForms spectrum analyzer and spectrogram display I did for microwave test equipment way back in like 2005: https://www.inchoatethoughts.com/wp-content/uploads/2009/08/graph-spectrogram.png
There are two things that contribute to the look you’re seeing. First, they’re using hardware filters and data acquisition devices to get back WAY more points that are already in the frequency domain. You’re just not going to get that sort of accuracy with an FFT algorithm.
Then, for the software plots with nice rounded corners, we’re cheating just as you predicted 😉 The rounded corners weren’t even as complex as doing a bezier curve, just a 2-3 pixel line thickness and anti-aliasing on the rendering side.
hey my dear firend. I use this “NAudioEngine.cs” class for control mp3. but I found the “pause” function does not work, when first I pause the mp3, never play it agian…
more
the stop() func replace the pause().
I have resolved this problem.