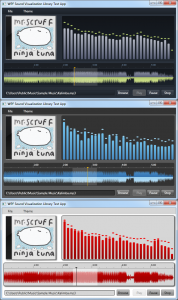
I’ve just launched my first CodePlex project, The WPF Sound Visualization Library. This thing is actually an extension of the Spectrum Analyzer control I made and part of a much larger secret project. Essentially, I’m taking all the WPF controls I’m creating in my other big project, dumping them out to their own project, slapping an MIT license on it, and releasing it to the public. They all have the common theme of being controls related to sound visualization/playback. Everything was designed so the look could be customized. I’m always looking for ways to improve their flexibility, so if you have ideas, let me know.
Stereo Waveform Timeline
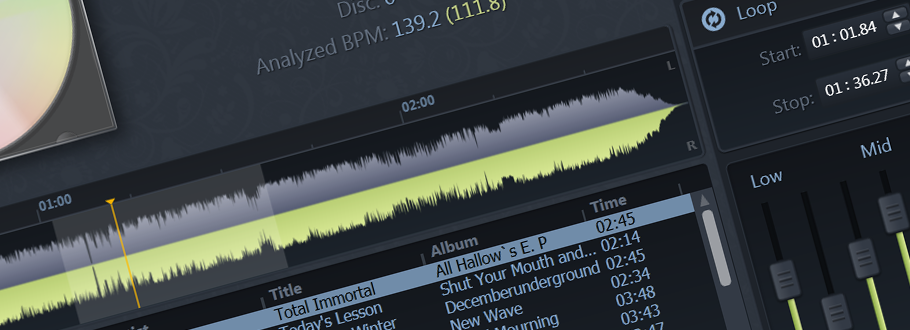
First up is a Waveform. I’ve seen a few people struggling to create these on the BASS forums, so I hope this is useful to the community. Right now, it only has stereo support. I hope to support Mono, Quad, and 5.1 channel displays soon. Aside from displaying a Waveform, this thing has the ability to set track position and a repeat section in the audio stream it is rendering.
One of the challenges in displaying a Waveform in WPF is making sure that it doesn’t kill performance while not appearing blurry. I’ve taken advantage of BitmapCache and some special scaling code so that this is handled well. The Waveform Timeline is broken down into four template parts: the waveform canvas, the timeline canvas, the progress indicator canvas, and the repeat region overlay canvas.
Spectrum Analyzer
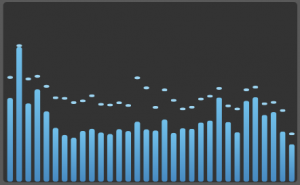
Next is my old friend the Spectrum Analyzer. Nothing really new to report here. I have lots of detail on this in my previous blog posts. I should note, however, there are a few minor fixes and an added property or two since the last time I posted Spectrum Analyzer source code to this blog.
Album Art Display
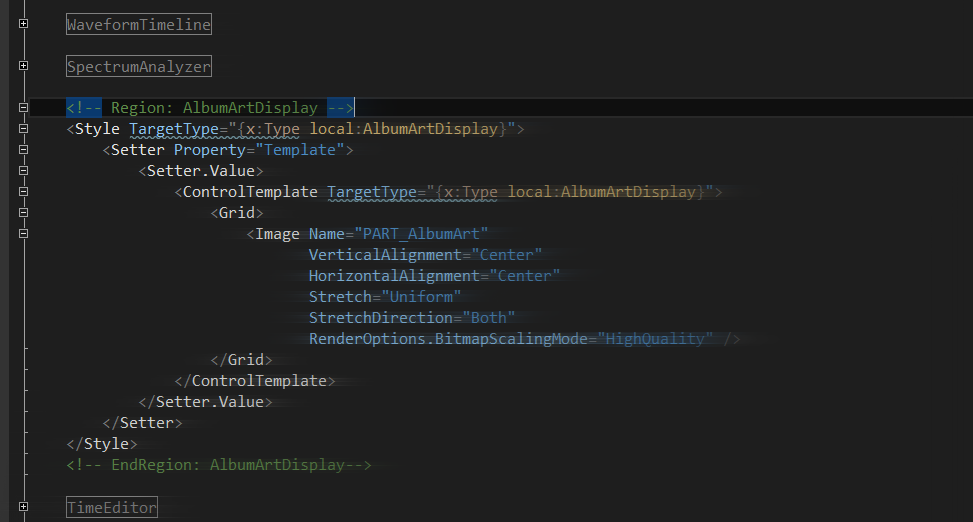
Finally, we have an album art display. Basically, it’ll take the album art image (presumably from MP3/AAC tags) and display it in a jewel case. I don’t know how much longer the kids will even remember jewel cases, but I still think they look cool in media applications. I’ve had the Album Art Display in a few of my example applications already, but I’ve refactored it a bit so it was a Control rather than a UserControl.


Hi,
the lib looks really great.
I saw that you tried to decouple data providing from the UI.
But the data providing mechanism is rather bound to Bass, right?
My problem is that I would like to use it with NAudio (base on the WPF Sample)
Do you have a hint how to use it with NAudio ->
I have a SampleAggregator which calculates a min/max value of a certain period of time, and a fft buffer (array of complex numbers). both are delivered to interested “listeners”.
Any help would be really nice.
TIA
Martin
Martin, I’ll be providing some “Getting Started” guides soon(ish). I’ll be doing one for BASS first, then I’ll work on NAudio’s. That said, you’re really not that far off. You just need to convert your Complex[] to a float[]. The FFT Data in Bass discards the imaginary part of the number, so if you take just the real portion of your array of complex numbers and create a float array with them, you should have what you need in the ISpectrumPlayer’s GetFFTData method. The other method you need is one that tells you what index in that array corresponds to a particular frequency. This is linear based on the size of the array. Your entire array spans half of your sample rate. You can do the calculation from there.
As a side note, you may consider doing a specialized FFT call that doesn’t return Complex numbers (and just the real numbers instead), as you’ll be wasting a decent amount of cycles for data you don’t need here (unless you’re using it for phase or other reasons).
Edit: I also be adding additional comments to that interface to explain what sort of FFT Data it expects.
Hi Jacob,
This library is fantastic. Nice work and thanks very much!
Kind regards,
Bill
Hi Jacob,
Thank you for publishing this great library!
I use the WaveFormTimeline with NAudio in WPF, and i’m wondering how to get more detail on the waveform when zoomed in.
Is this possible?
Keep it up,
Richard
Hi!
Very useful lib, must say! As a beginner I’m reading through sources just for learning to write nice code like good programmers do. I’m also searching for approach to make static spectrogram control.
There is one thing I didn’t quite understand in the UpdateSpectrumShapes() method of SpectrumAnalyzer class (correct me if I’m wrong). You are running this cycle:
for (int i = minimumFrequencyIndex; i <= maximumFrequencyIndex; i++)
{ …. }
which is in my case 1857 runs (for 44100 sample rate) with some calculations on each iteration, when seems like you only need to do it for each item of int[] barIndexMax array (i.e. for each spectrum analyzer band).
I have tried to change code like this:
for (int i = minimumFrequencyIndex; i <= maximumFrequencyIndex; i++)
{
int currentIndex = IsFrequencyScaleLinear ? barIndexMax[barIndex] : barLogScaleIndexMax[barIndex];
if (i != currentIndex) continue;
…
}
…and it works=).
Or maybe there is a reason to take all frequencies band in foreach…
pardon me, friend. I check it again, read the comments and enlightenment comes). Drawing maximum values for band really gives much smoother view!
Hi Jacob,
Thanks a lot for your amazing work and documentation!
I have successfully imported the Spectrum Analyzer in my project and it works just fine, but i can`t find a way to get the single bars` values from the SpectrumAnalyzer control.
Maybe some kind of event handler will do the work, I just can`t figure out which one it is. Can you please give me a hint on that, so i can send an array of the values through serial port to another device that will read it.
Any help is highly appreciated!
Best Regards, Nikolay
Hey Nikolay,
There really isn’t a way to do that built in. However, you could add an event that is called in the “UpdateSpectrumShapes()” method. In the EventArgs, you could either include the channel peak data or perhaps the barShapes[] height properties. If the device you’re passing this to (via the serial port) is meant to display a specific number of bars, you’ll want to make sure you coerce my spectrum analyzer to have the same number of bars as well. Hope that helps!
Hey Jacob,
Thanks for the good advice!
What I did is adding a custom event in the WPFSoundVisualizationLib, which is triggered every time the spectrum shapes are changed. After that I needed to expose the float[] channelPeakData field to public, so I can read it every time my custom event is triggered.
Since the event is added to the control code, it works perfectly well with all bar counts (3 in my case – Red, Green and Blue).
Thanks a lot for your help!
Best Regards, Nikolay