
UPDATE:The WPF Spectrum Analyzer is now part of the WPF Sound Visualization Library. That is where you will find source code for the latest and most-stable versions of the Spectrum Analyzer. Also, this post has been updated and superseded by this one. I’m leaving this one here for historical purposes, but check out the other article for a more performant and scalable version the control.
—
A coworker and I were recently talking about doing audio visualization with Windows Presentation Foundation (WPF). One of the more common visualization techniques for music applications is to slap in a simple banded spectrum analyzer. I thought such spectrum analyzers would be easy to find, as they’re included in many applications written in toward all sorts of platforms. A bit surprisingly, however, was that such visualizations in WPF aren’t as common as I would have expected. I thought I could use the rarity of such controls as an opportunity to play around with some fast rendering techniques in WPF. I was fairly pleased with the outcome, so I thought I would share the results.

The Spectrum Analyzer Control
About Playing Audio
If any of you have tried to do anything with audio in .NET, you’ve probably found the out-of-the-box functionality to be pretty limited. WPF has some enhancements in this area, but it is nowhere near some of the alternatives. Going the other way, one may choose to use direct references to DirectSound to get the power they need. However, this leaves it up to you, the coder, to deal with all the scaling back when the user’s machine doesn’t meet the needs. I find it much easier to use some of the third party sound APIs out there who take care of all these gritty details
My “sound suite” of choice is the BASS API. BASS is loaded with features. Along with getting sound set up to play, it also has the ability to read all sorts of file formats, do effects processing, record sound, and more. However, BASS is unmanaged. To interface BASS with .NET, one will need the aptly named BASS.NET. At a passing glance, one may see BASS.NET as a thin .NET wrapper over the BASS API. However, it actually has some very useful additions. Benefits include tag reading support, useful methods for parsing FFT data, and even some visualizers included (but they are targeted to WinForms/GDI+). It was actually the source code for these visualizers that I used as a starting point for this WPF control. BASS.NET’s author, Bernd Niedergesaess (a.k.a radio42), was kind enough to let me share this source code with you today even though he really did all of the heavy-lifting/pioneering for this project during his development of BASS.NET.
The Spectrum Analyzer
Now, I’m not new to writing Spectrum Analyzers. Previous software engineering jobs had me writing controls for Windows-based Spectrum Analyzers in the past. However, these weren’t for audio visualization, but were more for scientific measurements of radio and microwave signals. One of the things I noticed about audio visualizations is that a lot of accuracy is ignored in favor of making the visualizer look and feel in line with what we perceive. I won’t go into great amounts of detail on this, but when you see funky methods being applied to FFT results in the source code, this is probably what is going on. One of the most common examples of this is that FFT data is never displayed on the Y-axis linearly, but rather using a square root function and a scaling factor. Without this, you see most of the visualizer moving very little, except for the occasional large burst of energy. This is NOT how your ears/brain perceive the sound you’re listening to.
So, let’s take a look at what the control looks like in XAML:
1 2 3 4 5 6 7 8 9 10 11 | <my:SpectrumAnalyzer x:Name="spectrumAnalyzer" Height="160" HorizontalAlignment="Stretch" VerticalAlignment="Bottom" BarSpacing="5" AveragePeaks="False" MinimumFrequency="20" MaximumFrequency="20000" BarCount="32" PeakFallDelay="10" BarHeightScaling="Decibel" /> |
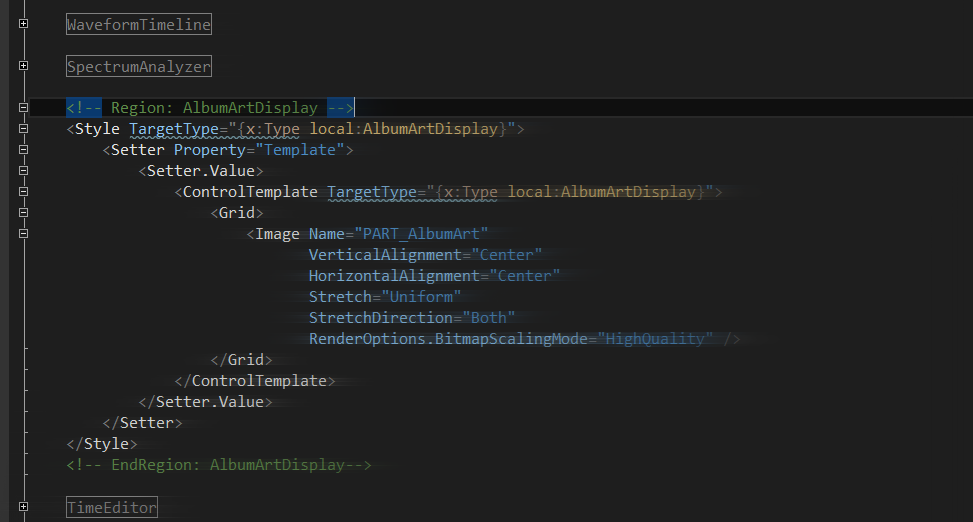
It all looks pretty straightforward. Besides the attributes I’ve shown on the control here, I also have included dependency properties to set brushes for the bars and their peaks, as well as a dependency property for the linearity of displayed channel data. Here’s the XAML for the Spectrum Analyzer control itself.
1 2 3 4 5 6 7 8 9 | <UserControl x:Class="BandedSpectrumAnalyzer.SpectrumAnalyzer" xmlns="http://schemas.microsoft.com/winfx/2006/xaml/presentation" xmlns:x="http://schemas.microsoft.com/winfx/2006/xaml"> <Canvas> <Image Name="SpectrumImage" HorizontalAlignment="Stretch" VerticalAlignment="Stretch" /> </Canvas> </UserControl> |
Shockingly simple, no? That’s because the meat of this control is in the code-behind. I’ve chosen to do a more classic pixel-based rendering technique for this UserControl. This is good and bad, but not the norm for WPF development. It’s good because it gives me a bit more control in terms of performance. It’s bad in that WPF is meant to be scaled freely, and now it is my responsibility to make that work well. Now, here’s where the real work happens.
1 2 3 4 5 6 7 8 9 10 11 12 13 14 15 16 17 18 19 20 21 22 23 24 25 26 27 28 29 30 31 32 33 34 35 36 37 38 39 40 41 42 43 44 45 46 47 48 49 50 51 52 53 54 55 56 57 58 59 60 61 62 63 64 65 66 67 68 69 70 71 72 73 74 75 76 77 78 79 80 81 82 83 84 85 86 87 88 89 90 91 92 93 94 95 96 97 98 99 100 101 102 103 104 105 106 107 108 109 110 111 112 113 114 115 116 117 118 119 120 121 122 123 124 125 126 127 128 129 130 131 132 133 134 135 136 137 138 139 140 141 142 143 144 145 146 147 148 149 150 151 152 153 154 155 156 157 158 159 160 161 162 163 164 165 166 167 168 169 170 171 172 173 174 175 176 177 178 179 180 181 182 183 184 185 186 187 188 189 190 191 192 193 194 195 196 197 198 199 200 201 202 203 204 205 206 207 208 209 210 211 212 213 214 215 216 217 218 219 220 221 222 223 224 225 226 227 228 229 230 231 232 233 234 235 236 237 238 239 240 241 242 243 244 245 246 247 248 249 250 251 252 253 254 255 256 257 258 259 260 261 262 263 264 265 266 267 268 269 270 271 272 273 274 275 276 277 278 279 280 281 282 283 284 285 286 287 288 289 290 291 292 293 294 295 296 297 298 299 300 301 302 303 304 305 306 307 308 309 310 311 312 313 314 315 316 317 318 319 320 321 322 323 324 325 326 327 328 329 330 331 332 333 334 335 336 337 338 339 340 341 342 343 344 345 346 347 348 349 350 351 352 353 354 355 356 357 358 359 360 361 362 363 364 365 366 367 368 369 370 371 372 373 374 375 376 377 378 379 380 381 382 383 384 385 386 387 388 389 390 391 392 393 394 395 396 397 398 399 400 401 402 403 404 405 406 407 408 409 410 411 412 413 414 415 416 417 418 419 420 421 422 423 424 425 426 427 428 429 430 431 432 433 434 435 436 437 438 439 440 441 442 443 444 445 446 447 448 449 450 451 452 453 454 455 456 457 458 459 460 461 462 463 464 465 466 467 468 469 470 471 472 473 474 475 476 477 478 479 480 481 482 483 484 485 486 487 488 489 490 491 492 493 494 495 496 497 498 499 500 501 502 503 504 505 506 507 508 509 510 511 512 513 514 515 | using System; using System.Collections.Generic; using System.ComponentModel; using System.Windows; using System.Windows.Controls; using System.Windows.Media; using System.Windows.Media.Imaging; using System.Windows.Threading; using Un4seen.Bass; namespace BandedSpectrumAnalyzer { /// <summary> /// Interaction logic for SpectrumAnalyzer.xaml /// </summary> public partial class SpectrumAnalyzer : UserControl { #region Fields private DispatcherTimer animationTimer; private RenderTargetBitmap anaylzerBuffer; private DrawingVisual drawingVisual = new DrawingVisual(); private float[] channelData = new float[2048]; private float[] channelPeakData; private int scaleFactorLinear = 9; private int scaleFactorSqr = 2; private int maxFFTData = 4096; private BASSData maxFFT = (BASSData.BASS_DATA_AVAILABLE | BASSData.BASS_DATA_FFT4096); private double bandWidth = 1.0; private double barWidth = 1; private int maximumFrequencyIndex = 2047; private int minimumFrequencyIndex = 0; private int sampleFrequency = 44100; private int[] barIndexMax; private int[] barLogScaleIndexMax; private BassEngine bassEngine; #endregion #region Dependency Property Declarations public static readonly DependencyProperty MaximumFrequencyProperty; public static readonly DependencyProperty MinimumFrequencyProperty; public static readonly DependencyProperty BarCountProperty; public static readonly DependencyProperty BarSpacingProperty; public static readonly DependencyProperty PeakFallDelayProperty; protected static readonly DependencyProperty StreamHandleProperty = DependencyProperty.Register("StreamHandle", typeof(int), typeof(SpectrumAnalyzer)); public static readonly DependencyProperty FrequencyScaleIsLinearProperty = DependencyProperty.Register("FrequencyScaleIsLinear", typeof(bool), typeof(SpectrumAnalyzer)); public static readonly DependencyProperty BarHeightScalingProperty = DependencyProperty.Register("BarHeightScaling", typeof(BarHeightScaling), typeof(SpectrumAnalyzer)); public static readonly DependencyProperty AveragePeaksProperty = DependencyProperty.Register("AveragePeaks", typeof(bool), typeof(SpectrumAnalyzer)); public static readonly DependencyProperty BarBrushProperty = DependencyProperty.Register("BarBrush", typeof(Brush), typeof(SpectrumAnalyzer)); public static readonly DependencyProperty PeakBrushProperty = DependencyProperty.Register("PeakBrush", typeof(Brush), typeof(SpectrumAnalyzer)); #endregion #region Dependency Properties /// <summary> /// The maximum display frequency (right side) for the spectrum analyzer. /// </summary> /// <remarks>This value should be somewhere between 0 and half of the maximum sample rate. If using /// the maximum sample rate, this would be roughly 22000.</remarks> [Category("Common")] public int MaximumFrequency { get { return (int)GetValue(MaximumFrequencyProperty); } set { SetValue(MaximumFrequencyProperty, value); } } /// <summary> /// The minimum display frequency (left side) for the spectrum analyzer. /// </summary> [Category("Common")] public int MinimumFrequency { get { return (int)GetValue(MinimumFrequencyProperty); } set { SetValue(MinimumFrequencyProperty, value); } } /// <summary> /// The number of bars to show on the sprectrum analyzer. /// </summary> /// <remarks>A bar's width can be a minimum of 1 pixel. If the BarSpacing and BarCount property result /// in the bars being wider than the chart itself, the BarCount will automatically scale down.</remarks> [Category("Common")] public int BarCount { get { return (int)GetValue(BarCountProperty); } set { SetValue(BarCountProperty, value); } } /// <summary> /// The brush used to paint the bars on the spectrum analyzer. /// </summary> [Category("Common")] public Brush BarBrush { get { return (Brush)GetValue(BarBrushProperty); } set { SetValue(BarBrushProperty, value); } } /// <summary> /// The brush used to paint the peaks on the spectrum analyzer. /// </summary> [Category("Common")] public Brush PeakBrush { get { return (Brush)GetValue(PeakBrushProperty); } set { SetValue(PeakBrushProperty, value); } } /// <summary> /// The delay factor for the peaks falling. This is relative to the /// refresh rate of the chart. /// </summary> [Category("Common")] public int PeakFallDelay { get { return (int)GetValue(PeakFallDelayProperty); } set { SetValue(PeakFallDelayProperty, value); } } /// <summary> /// The spacing, in pixels, between the bars. /// </summary> [Category("Common")] public double BarSpacing { get { return (double)GetValue(BarSpacingProperty); } set { SetValue(BarSpacingProperty, value); } } /// <summary> /// If true, the bar height will be displayed linearly with the intensity value. /// Otherwise, the bars will be scaled with a square root function. /// </summary> [Category("Common")] public BarHeightScaling BarHeightScaling { get { return (BarHeightScaling)GetValue(BarHeightScalingProperty); } set { SetValue(BarHeightScalingProperty, value); } } /// <summary> /// If true, this will display the frequency scale (X-axis of the spectrum analyzer) /// in a linear scale. Otherwise, the scale will be logrithmic. /// </summary> [Category("Common")] public bool FrequencyScaleIsLinear { get { return (bool)GetValue(FrequencyScaleIsLinearProperty); } set { SetValue(FrequencyScaleIsLinearProperty, value); } } /// <summary> /// If true, each bar's peak value will be averaged with the previous /// bar's peak. This creates a smoothing effect on the bars. /// </summary> [Category("Common")] public bool AveragePeaks { get { return (bool)GetValue(AveragePeaksProperty); } set { SetValue(AveragePeaksProperty, value); } } protected int StreamHandle { get { return (int)GetValue(StreamHandleProperty); } set { SetValue(StreamHandleProperty, value); if (StreamHandle != 0) { BASS_CHANNELINFO info = new BASS_CHANNELINFO(); Bass.BASS_ChannelGetInfo(StreamHandle, info); sampleFrequency = info.freq; } else { sampleFrequency = 44100; } BarMappingChanged(this, EventArgs.Empty); } } #endregion #region Dependency Property Validation private static object CoerceMaximumFrequency(DependencyObject d, object value) { SpectrumAnalyzer spectrumAnalyzer = (SpectrumAnalyzer)d; if ((int)value < spectrumAnalyzer.MinimumFrequency) return spectrumAnalyzer.MinimumFrequency + 1; return value; } private static object CoerceMinimumFrequency(DependencyObject d, object value) { int returnValue = (int)value; SpectrumAnalyzer spectrumAnalyzer = (SpectrumAnalyzer)d; if (returnValue < 0) return returnValue = 0; spectrumAnalyzer.CoerceValue(MaximumFrequencyProperty); return returnValue; } private static object CoerceBarCount(DependencyObject d, object value) { int returnValue = (int)value; returnValue = Math.Max(returnValue, 1); return returnValue; } private static object CoercePeakFallDelay(DependencyObject d, object value) { int returnValue = (int)value; returnValue = Math.Max(returnValue, 0); return returnValue; } private static object CoerceBarSpacing(DependencyObject d, object value) { double returnValue = (double)value; returnValue = Math.Max(returnValue, 0); return returnValue; } #endregion #region Constructors static SpectrumAnalyzer() { // MaximumFrequency FrameworkPropertyMetadata maximumFrequencyMetadata = new FrameworkPropertyMetadata(20000); maximumFrequencyMetadata.CoerceValueCallback = new CoerceValueCallback(SpectrumAnalyzer.CoerceMaximumFrequency); MaximumFrequencyProperty = DependencyProperty.Register("MaximumFrequency", typeof(int), typeof(SpectrumAnalyzer), maximumFrequencyMetadata); // MinimumFrequency FrameworkPropertyMetadata minimumFrequencyMetadata = new FrameworkPropertyMetadata(0); minimumFrequencyMetadata.CoerceValueCallback = new CoerceValueCallback(SpectrumAnalyzer.CoerceMinimumFrequency); MinimumFrequencyProperty = DependencyProperty.Register("MinimumFrequency", typeof(int), typeof(SpectrumAnalyzer), minimumFrequencyMetadata); // BarCount FrameworkPropertyMetadata barCountMetadata = new FrameworkPropertyMetadata(24); barCountMetadata.CoerceValueCallback = new CoerceValueCallback(SpectrumAnalyzer.CoerceBarCount); BarCountProperty = DependencyProperty.Register("BarCount", typeof(int), typeof(SpectrumAnalyzer), barCountMetadata); // BarSpacing FrameworkPropertyMetadata barSpacingMetadata = new FrameworkPropertyMetadata(5.0); barSpacingMetadata.CoerceValueCallback = new CoerceValueCallback(SpectrumAnalyzer.CoerceBarSpacing); BarSpacingProperty = DependencyProperty.Register("BarSpacing", typeof(double), typeof(SpectrumAnalyzer), barSpacingMetadata); // PeakFallDelay FrameworkPropertyMetadata peakFallDelayMetadata = new FrameworkPropertyMetadata(5); peakFallDelayMetadata.CoerceValueCallback = new CoerceValueCallback(SpectrumAnalyzer.CoercePeakFallDelay); PeakFallDelayProperty = DependencyProperty.Register("PeakFallDelay", typeof(int), typeof(SpectrumAnalyzer), peakFallDelayMetadata); } public SpectrumAnalyzer() { PeakBrush = new SolidColorBrush(Colors.GreenYellow); BarBrush = new LinearGradientBrush(Colors.ForestGreen, Colors.DarkGreen, new Point(0, 1), new Point(0, 0)); InitializeComponent(); animationTimer = new DispatcherTimer(DispatcherPriority.ApplicationIdle); animationTimer.Interval = TimeSpan.FromMilliseconds(25); animationTimer.Tick += new EventHandler(animationTimer_Tick); DependencyPropertyDescriptor backgroundDescriptor = DependencyPropertyDescriptor.FromProperty(BackgroundProperty, typeof(SpectrumAnalyzer)); backgroundDescriptor.AddValueChanged(this, AppearanceChanged); DependencyPropertyDescriptor barBrushDescriptor = DependencyPropertyDescriptor.FromProperty(BarBrushProperty, typeof(SpectrumAnalyzer)); barBrushDescriptor.AddValueChanged(this, AppearanceChanged); DependencyPropertyDescriptor maxFrequencyDescriptor = DependencyPropertyDescriptor.FromProperty(MaximumFrequencyProperty, typeof(SpectrumAnalyzer)); maxFrequencyDescriptor.AddValueChanged(this, BarMappingChanged); DependencyPropertyDescriptor minFrequencyDescriptor = DependencyPropertyDescriptor.FromProperty(MinimumFrequencyProperty, typeof(SpectrumAnalyzer)); maxFrequencyDescriptor.AddValueChanged(this, BarMappingChanged); DependencyPropertyDescriptor barCountDescriptor = DependencyPropertyDescriptor.FromProperty(BarCountProperty, typeof(SpectrumAnalyzer)); maxFrequencyDescriptor.AddValueChanged(this, BarMappingChanged); BarMappingChanged(this, EventArgs.Empty); if (!DesignerProperties.GetIsInDesignMode(this)) { bassEngine = BassEngine.Instance; UIHelper.Bind(bassEngine, "ActiveStreamHandle", this, StreamHandleProperty); animationTimer.Start(); } } void animationTimer_Tick(object sender, EventArgs e) { UpdateSpectrum(); } #endregion #region Event Overrides protected override void OnRender(DrawingContext dc) { base.OnRender(dc); anaylzerBuffer = new RenderTargetBitmap((int)RenderSize.Width, (int)RenderSize.Height, 96, 96, PixelFormats.Pbgra32); if (SpectrumImage != null) { SpectrumImage.Source = anaylzerBuffer; } UpdateSpectrum(); } protected override void OnRenderSizeChanged(SizeChangedInfo sizeInfo) { base.OnRenderSizeChanged(sizeInfo); BarMappingChanged(this, EventArgs.Empty); } #endregion #region Private Utility Methods private void UpdateSpectrum() { if (bassEngine == null || drawingVisual == null || anaylzerBuffer == null || RenderSize.Width < 1 || RenderSize.Height < 1) return; if (!bassEngine.IsPaused && (StreamHandle == 0 || (GetFFTBuffer(StreamHandle, (int)maxFFT) < 1))) return; // Clear Canvas anaylzerBuffer.Clear(); using (DrawingContext drawingContext = drawingVisual.RenderOpen()) { // Draw background if applicable. if (Background != null) drawingContext.DrawRectangle(Background, null, new Rect(0, 0, RenderSize.Width, RenderSize.Height)); // Draw Spectrum Lines RenderSpectrumLines(drawingContext); } anaylzerBuffer.Render(drawingVisual); } private int GetFFTBuffer(int handle, int length) { return Un4seen.Bass.Bass.BASS_ChannelGetData(handle, this.channelData, length); } private void RenderSpectrumLines(DrawingContext dc) { double fftBucketHeight = 0f; double barHeight = 0f; double lastPeakHeight = 0f; double peakYPos = 0f; double height = this.RenderSize.Height; int barIndex = 0; double peakDotHeight = Math.Max(barWidth / 2.0f, 1); double barHeightScale = (height - peakDotHeight); const double minDBValue = -90; const double maxDBValue = 0; const double dbScale = (maxDBValue - minDBValue); for (int i = minimumFrequencyIndex; i < maximumFrequencyIndex; i++) { // If we're paused, keep drawing, but set the current height to 0 so the peaks fall. if (bassEngine.IsPaused) { barHeight = 0f; } else // Draw the maximum value for the bar's band { switch (BarHeightScaling) { case BandedSpectrumAnalyzer.BarHeightScaling.Decibel: double dbValue = 20 * Math.Log10((double)channelData[i]); fftBucketHeight = ((dbValue - minDBValue) / dbScale) * barHeightScale; break; case BandedSpectrumAnalyzer.BarHeightScaling.Linear: fftBucketHeight = (channelData[i] * scaleFactorLinear) * barHeightScale; break; case BandedSpectrumAnalyzer.BarHeightScaling.Sqrt: fftBucketHeight = (((Math.Sqrt((double)this.channelData[i])) * scaleFactorSqr) * barHeightScale); break; } if (barHeight < fftBucketHeight) barHeight = fftBucketHeight; if (barHeight < 0f) barHeight = 0f; } // If this is the last FFT bucket in the bar's group, draw the bar. int currentIndexMax = FrequencyScaleIsLinear ? barIndexMax[barIndex] : barLogScaleIndexMax[barIndex]; if (i == currentIndexMax) { // Peaks can't surpass the height of the control. if (barHeight > height) barHeight = height; if (AveragePeaks && barIndex > 0) barHeight = (lastPeakHeight + barHeight) / 2; peakYPos = barHeight; if (channelPeakData[barIndex] < peakYPos) this.channelPeakData[barIndex] = (float)peakYPos; else this.channelPeakData[barIndex] = (float)(peakYPos + (PeakFallDelay * this.channelPeakData[barIndex])) / ((float)(PeakFallDelay + 1)); double xCoord = BarSpacing + (barWidth * barIndex) + (BarSpacing * barIndex) + 1; // Draw the bars if (BarBrush != null) dc.DrawRectangle(BarBrush, null, new Rect(xCoord, (height - 1) - barHeight, barWidth, barHeight)); // Draw the peaks if (PeakBrush != null) dc.DrawRectangle(PeakBrush, null, new Rect(xCoord, (height - 1) - this.channelPeakData[barIndex], barWidth, peakDotHeight)); lastPeakHeight = barHeight; barHeight = 0f; barIndex++; } } } #endregion #region Dependency Property Changed Handlers private void AppearanceChanged(object sender, EventArgs e) { UpdateSpectrum(); } private void BarMappingChanged(object sender, EventArgs e) { barWidth = Math.Max((int)((RenderSize.Width - (BarSpacing * (BarCount + 1))) / (double)BarCount), 1); maximumFrequencyIndex = Math.Min(Utils.FFTFrequency2Index(MaximumFrequency, maxFFTData, sampleFrequency) + 1, 2047); minimumFrequencyIndex = Math.Min(Utils.FFTFrequency2Index(MinimumFrequency, maxFFTData, sampleFrequency), 2047); bandWidth = Math.Max(((double)(maximumFrequencyIndex - minimumFrequencyIndex)) / RenderSize.Width, 1.0); int actualBarCount = Math.Max((int)((RenderSize.Width - BarSpacing) / (barWidth + BarSpacing)), 1); channelPeakData = new float[actualBarCount]; int indexCount = maximumFrequencyIndex - minimumFrequencyIndex; int linearIndexBucketSize = (int)Math.Round((double)indexCount / (double)actualBarCount, 0); List<int> maxIndexList = new List<int>(); List<int> maxLogScaleIndexList = new List<int>(); double maxLog = Math.Log(actualBarCount, actualBarCount); for (int i = 1; i < actualBarCount - 1; i++) { maxIndexList.Add(minimumFrequencyIndex + (i * linearIndexBucketSize)); int logIndex = (int)((maxLog - Math.Log(actualBarCount - i, actualBarCount)) * indexCount) + minimumFrequencyIndex; maxLogScaleIndexList.Add(logIndex); } maxIndexList.Add(maximumFrequencyIndex); maxLogScaleIndexList.Add(maximumFrequencyIndex); barIndexMax = maxIndexList.ToArray(); barLogScaleIndexMax = maxLogScaleIndexList.ToArray(); } #endregion } public enum BarHeightScaling { Decibel, Sqrt, Linear } } |
The UpdateSpectrum() method is handling the writing of our bar drawing to the buffer. Using a DrawingVisual and DrawingContext directly gives me great performance. I currently have the timer on this Spectrum Analyzer to draw every 25 ms (which translates to about 40 FPS). Even at this speed, I find the application barely registering 1% CPU, and that’s in the confines of a virtual machine. The actual method I’m using to draw FFT data is inside of RenderSpectrumLines(). You’ll note that we take the peak value in the frequency range of a bar and display that. This is all pretty standard fare for this sort of spectrum analyzer. I encourage you to read up on Fast Fourier Transforms and Audio Processing if this interests you.

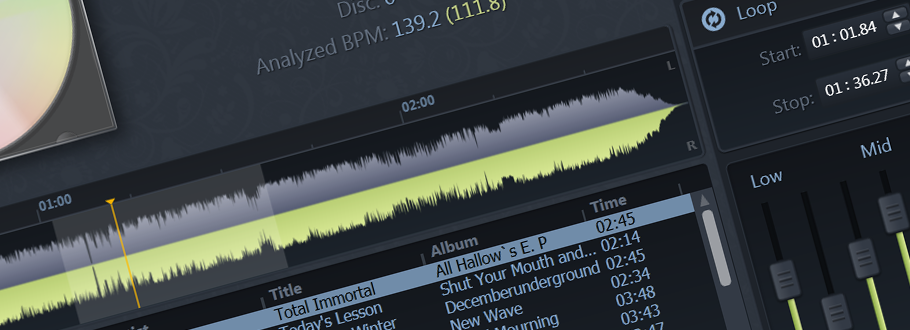
Spectrum Analyzer Control With A Light Theme
That’s pretty much it! As you can see, I dropped the control in a Window, added some basic playback controls, tag reading, and fancy WPF reflection to give it a nice look. I encourage you to download the source code if you’re interested in including something like this in your own WPF application. If you have questions, see room for improvement, or have useful information I left out, please leave me a comment!
Download the Spectrum Analyzer and Source Code As Part of the WPF Sound Visualization Library
Download Source Code For This Post (Deprecated!)
Update 2/6/2011:
- Cleaned up some unused references. (Had System.Drawing in there, oops!)
- Added XML comments to dependency properties on SpectrumAnalyzer UserControl
- Revised theme selection layout
- Exposed BarSpacing Property (was accidentally made private)
- Added AveragePeaks Dependency Property
- Gradiated backgrounds to demonstrate true WPF transparency support
- Added option to make the X Axis (Frequency) scale logrithmicly
- Added another height scaling configuration, decibel. “BarHeightIsLinear” property replaced with “BarHeightScaling”
- Optimized bar bucket check.
- Moved all of the Bass logic into an INotifyPropertyChanged class so binding is possible
Killer article!
so did you use the BASS Spectrum code at all?
Are you converting the WinForms/GDI+ bitmap stuff to WPF or just doing the graphics in Native WPF?
Gonna download and play with the source code now……8)
thx!
Steve
Thanks for the kind comments!
The code in BASS.NET was an implementation starting-off point for me, but really wrote it all out to be pure WPF. I wasn’t so concerned about generating the images and rendering them to the screen, that’s something I’ve done in WPF in a couple of different contexts now, so there was no learning curve there. I was more concerned about having roughly similar visual interpretations of FFT data (i.e., the height of my visualizer’s bars were similar to the visualizers included in BASS.NET). I don’t reference System.Windows.Forms or System.Drawing at all, nor do I use the stuff from BASS’s visualization.
A really useful article on WPF and an insight into audio processing.
I am just starting to get into DSP and I’m currently looking to build a Waterfall Spectral analyzer for real time audio processing. I’d be interested in your thoughts/approach to doing this in WPF, instead of the old WinForms GDI+/bmp methods.
Thanks.
James
That may be a little trickier because of performance. The so called “Waterfall” approach is just a scrolling spectrogram. I actually did one in GDI+ a long time ago (though it scrolled horizontally, not vertically). You can see a screenshot of it in an old blog post. For WPF, I would use a RenderTargetBitmap, a DrawingVisual, and a DrawingContext for that task. There’s no “DrawPixel” so you’ll have to make do with DrawRectangle. The challenge will be then offsetting what you currently have drawn down before drawing the next frame (to create the scrolling effect). I think you could use DrawingContext.DrawImage where the source image is actually your RenderTargetBitmap buffer (i.e., the same as your destination image), and the rectangle would just be vertically offset by however much you need for that frame’s scroll. What I can’t really gauge in all of this is how performance will be. Undoubtedly, it will depend a bit on how big you plan to have the control. Let me know how it goes!
Thanks Jacob,
Your old post is looks very helpful and pretty much what I want to build. I will read over your old old code and the tips above and see if I can start building something. It’s good to find someone who really knows their stuff in this area, there doesn’t appear to be many software engineers using c# for the likes of this, it’s usually c++.
James
First of all i love your your work and keep it up it’s amazing.
I got a question which honestly is making me feel like an idiot but how do you add the spectrum controls to the toolbox?
Thank,
Luke.
Luke, they should be in your toolbox as soon as you compile them or reference the assembly. It’ll be under a category with the name of the Assembly they’re in. I’ll be putting in some nicer toolbox support soon (icons and the likes). Keep in mind, you’ll only see them in your toolbox if you’re in the XAML design view.
I wan’t spectrum to be that wide like in the screenshot
I just downloaded this program and test it, why the spectrum be small in the middle? T_T